Friday, September 16, 2011

Red Stack / Green Stack


The total for the red stack is 150 kWh/day
The total for the green stack is 125 kWh/day

Green Stack: Geothermal

To find the theoretical energy of geothermal power in the Netherlands we used the McKay book to approximate the value.

The population density of the Netherlands is approximately 400 people/km^2

This is about 10 times more than the world's populaion density according to Mckay.

The UK has a population density 5 times that of the world.

According to Mckay geothermal can offer, at most, 2 kWh/d per person

So, the Netherlands, being twice the population density of the UK, should only be able to supply

1 kWh/d per person


Green Stack: Tide

To find the theoretical energy of tide on the shore of the Netherlands the following calculations were done:

Barrages
Assume a power density of 30 W/m^2 contributed by a barrage
To calculate the power:
               = 30 W/m^2 * 41500 * 10^6 m^2 * 2 (high/low tide) * 24 hours / 16.5 * 10^6
               = 3.6 kWh/d per person

Tidal Stream Farms
Assume a power density of 2 knots = 60 W/m^2 for tidal stream farms
Calculation:
               = 60 W/m^2 * 41500 * 10^6 m^2 * 24 hours / 16.5 * 10^6
               = 3.6 kWh/d per person

Tidal Lagoons
Assume a power density of 4.5 W/m^2 for tidal lagoons
Calculation:
               = 4.5 W/m^2 * 41500 * 10^6 m^2 * 24 hours / 16.5 * 10^6
               = 0.65 kWh/d per person

Total power = 7.85 kWh/d per person


Green Stack: Wave


To find the theoretical energy of waves on the shore of the Netherlands the following calculations were done:

The Netherlands coastline is 450 km long and the population is 16.5 million people.
                  = (450 * 10^3) / (16.5 * 10^6) = .03 meters per person of coastline

The power density of the Atlantic Ocean is 40 kW/m
To calculate the raw incoming power...
                  = .03 m per person * 40 kW/m * 24 hours = 28.8 kWh/d per person

Assume that wave machines are 50% efficient and 50% of the coastline is used so overall 25% of the possible power is used.
                  = 28.8 * .25 = 7.2 kWh/d per person


Green Stack: Deep offshore wind

To find the theoretical energy per day per person of deep offshore wind in the Netherlands the following calculations were done:
Assume the deep offshore area is twice the size of the shallow offshore area, so the area is 3600 km^2
Assume the average wind speeds are similar to that of the coastline
Also, we'll assume that 50% of the deep offshore area can be used

3.5 kWh/d (shallow offshore energy) * 2 (double in size) * 2 (50% rather than 25%)
              
= 14 kWh/d per person


Green Stack: Shallow offshore wind


To find the theoretical energy per day per person of shallow offshore wind in the Netherlands the following calculations were done:

Assume the shallow area of the coastline is 1800 km^2
Assume the average wind speed on the coast is 15 mph given that the average wind speed on land is 11 mph.  15 mph = 6.7 m/s
To compute the effective velocity you must add 1.5 so the effective velocity is 8.2 m/s
The density of air = 1.22 kg/m^3

Power per unit area
                    = π/400 ρv^3 = (π/400) * 1.22 kg/m^3* (8.2 m/s)^3 = 5.3 W/m^2

Assume that 25% of shallow water is used
                    = .25 * 5.3 W/m^2 * (1800 * 10^6 m^2) * 10^-9 = 2.385 * 10^6 kW

Possible shallow offshore wind power per person, per day
                    = (2.385 * 10^6 kW) * 24 hours / (16.5 * 10^6 people) = 3.5 kWh/d per person


Green Stack: Hydro


The majority of the Netherlands is at or below sea level which is not ideal for hydroelectric power.
They have old water mills but these produce power on such a small scale that they are negligible.

Looking at the calculation that McKay used, if Amsterdam was chosen with 833 mm of annual rainfall & an elevation of 2m, the kWh/day per person is minimal

Even with the hydroelectric capacity insatlled in major rivers, it is still way too small to matter.

38000kW capacity  Installed Hydro Capacity

38000*24hr/365day/16500000 people = 0.00015 kWh/day per person

Not impressed

Green Stack: Biomass:food, biofuel, wood, waste including landfill gas

To estimate the theoretical energy generated from biomass in the Netherlands the following calculations were used:

Assume 50% of the country can be used for energy crops that can produce .5 W/m^2

To estimate m^2 per person
                (41.5 * 10^9 m^2 * .5) / 16500000 people = 1260 m^2 per person

To find the kWh / d per person
                .0005 kW/m^2 * 1260 m^2 per person * 24 hours = 15 kWh / d per person


Green Stack: PV farm

For PV farms it was assumed that 5% of the land in the Netherlands could be used. (probably too optimistic).

Total land area = 41,500 km^2
(41500*10^6 m^2)/16500000 people = 2515 m^2/person

2515*.05 = 125 m^2/person

Using 10% efficient panels

(0.10)(110 W/m^2)(125 m^2/person)/1000kW(24 hr) = 33 kWh/day

Green Stack: PV

Using 20% efficient panels (McKay)

PV= .20(120 W/m^2) = 24 W/m^2
     = (10 m^2)(24 W/m^2) / 1000 km (24hr) = 5.76 kWh


Green Stack: Solar Heating

477 people/km^2 Source: Population density
The Netherlands has 7 million households that average 74 m^2 in size.
7 million * 74 m^2 = 518000000 m^2 = 518 km^2 of total area covered by houses.
around 50% of that could be used for solar panels.
= 259 km^2 of useable solar panel area

1000 W/m^2 of area oriented towards the sun. The Netherlands is located around the same latitude as the UK so McKay's assumptions could be used.

Intensity was reduced by 60 % and available daylight was not as bad as UK so the  average raw power of sunshine per square metre of south-facing roof in Britain is roughly 120W/m2, and the average raw power of sunshine per square metre of flat ground is roughly 110W/ m^2

Assume panels are 50 % efficient.

0.5(10m^2)(120W/m^2)/1000kW*24hr = 14.4 kWh


Dodge Dakota Energy Consumption

Wednesday, September 14, 2011

Green Stack: Wind

To find the theoretical power per unit area of wind in the Netherlands, the following information and calculations were used:

The average wind speed for the Netherlands is 11 mph

11 mph * 0.44704 = 5 m/s (Add 1.5 m/s to that number for effective velocity)

Average wind speed is 6.5 m/s

The density of air is 1.22 kg/m^3  (source: density of air)

Power per unit area of land = (50%[1/(2ρv^3 (π/4 d^2 ) )])/〖(5d)〗^2
                                          = π/400 ρv^3
                                          = π/400(1.22)(6.5)^3 = 2.63 W/m^2

Assume 5% of the available land can be used for wind power
                                          = .05*2.63 W/m^2 * (41500 * 10^6 m^2) * 10^-9 = 5.45 * 10^6 kW

Possible wind power per person, per day
                 = (5.45 * 10^6 kw) * 24 hours / (16.5 * 10^6 people) = 7.93 kWh/d per person

Tuesday, September 13, 2011

Red Stack: Transporting stuff

Transporting stuff was calculated as follows:

Using the figures from the following study: Transporting Stuff  P. 36 (v557)

Transporting stuff energy consumption = 32.7 GJ = 32700 MJ = 9083.33 kWh/yr = 10.82 kWh/day


Red Stack: Stuff

The same study and calculations could be used for stuff. Included in the figures were household effects (furniture, appliances, tools, etc), clothing and footwear, and hygiene products.
Source: Stuff
Household effects (p29-31)                          116.7 GJ
Clothing and footwear (p31-33)                        7.6 GJ
Hygiene (p33-34)                                           17.1 GJ
141.4 GJ = 141400 MJ = 39277.78 kWh/yr = 46.79 kWh/day per person

Red Stack: Food, Farming, Fertilizer

Based on the same study from the previous two posts, the energy consumption for food was calculated. The food ranged from bread to milk, meat to vegetables and everything in between. A table would have been included but it was too large. To view a list of all the food analyzed, click on the link below and go to pages 25-29.
The consumption of food = 41.6 GJ = 41600 MJ = 11556 kWh/year = 13.77 kWh/day per person
Note: This number takes farming & fertilizer into consideration.

Red Stack: Lighting

Lighting was calculated using the same study based on K. Vringer & K. Blok's Energy policy 23  "The direct and Indirect Energy Requirements of Household in the Netherlands"
Based on the heating and cooling study of households in the Netherlands:

Heating and Lighting = 88.6 GJ which broke down as 51.7 GJ for electricity, 28.1 GJ natural gas, and 8.8 GJ for lights.

8.8*1000 = 8800 MJ = 2444.44 kWh/year

2444.44/365/2.3 = 2.9 kWh/day per person

This was very close to McKay's figures so the assumption that each person used 1.3 kWh/day at work was used.

2.9 + 1.3 = 4.2 kWh/day for lighting                                     

Red Stack: Heating and Cooling

The average temperature in the Netherlands is fairly cool. Even in the summer months the high usually only reaches the low 70's , so cooling is negligable.

The calculations for the heating part were done a little different than McKay, but were effective.

Based on an in depth study using energy bills and usage per household per year the heating requirements in the Netherlands were found to be:

cookers 0.2 GJ
other cooking 0.2 GJ
Washing Mahine 0.3 GJ
refrigerators 0.2 GJ
Heating 79.8 GJ (This includes hot water & heating the conditioned space)

More in depth figures & calculations can be viewed at:
The Direct and Indirect Energy Requirements of Dutch Households

The numbers were converted to MJ and then, using microsoft converter, converted to kWh/year

[60.7 GJ] *[1000] = 60700MJ = 22417 kWh/year per household

The average household has 2.3 people

[22417 kWh/yr] / [365 days/yr] / 2.3 = 26.7 kWh/day


Note: These stats are from 1995 so the final figure may be a little high due to people cutting down on usage and appliances becoming more efficient.

Monday, September 12, 2011

Red Stack: Planes

This post will analyze the power consumption per day per person due to plane travel

For this analysis, information from Amsterdam's Schiphol international airport and technical information from Boeing were used to aid in the calculations.

An estimated 43.6 million total passengers pass through Amsterdam's main airport annually.
33 % of those passengers are residents of the Netherlands.
Source :
 Schiphol international airport (click on 2009)

Figure 1. Passenger Profile Schiphol International Airport

Based on the total population of 16.5 million, the amount of flights a person from the Netherlands takes per year was estimated as follows:

[43,600,000]*[0.33] = 14,388,000 flights involving residents of the Netherlands per year
14,388,000/16,500,000 = 0.872 flights per year (avg resident takes 0.872 flights per year)

Figure 2. Passenger Movements

An air transport movement is any arrival or departure through the airport.
There are 30 different types of planes that carry passengers to and from this airport annually. For the sake of a quick estimate, the Boeing 737-800 was used due to it being the most used plane. It is a next generation plane and uses less energy than old school planes. To help offset this, an older plane (the Boeing 747-400) was used as well and the two were averaged together. (This is just an estimate but is adequate for this exercise).

Using the Boeing 737-800, the power usage per day was calculated as follows:

Passenger capacity: 2-class - 162     1-class - 189      Average: 175 passengers
Max fuel capacity: 6,875 U.S. gallons = 26,020 litres
Max range: 3,115 nautical miles = 5,765 km
Fuel (calorific value): 10 kWh/L (soure: McKay)

Assuming each person takes a round trip:

[2]*[26,020 L] / [175 passengers] * [10 kWh/L] = 2974 kWh/passenger per year

Because each citizen on average takes 0.872 flights per year:

[0.872]*[2974 kWh] / 365 days = 7.11 kWh/day


Using the Boeing 747-400, the power usage per day was calculated as follows:

Passenger capacity: 3-class - 416   2-class - 524     Average: 470 passengers
Max fuel capacity:  216,840 Litres
Max Range: 13,450 km

[2]*[216840 L] / [470 passengers] * 10 kWh/L = 9227

0.872*[9227 kWh] / 365 days = 22 kWh/day

Averaging the two together results in the estimated power consumed per day, per person is

14.55 kWh/day   
Sources for the Boeing 737-800 and 747-400 came from:


Red Stack: Cars

Note: All future "Red Stack" and "Green Stack" posts appearing in this blog will focus on the Netherlands.


This post will analyze the power used, per person per day, due to driving cars.

The total population of the Netherlands is 16.5 million. (Source: google.com/publicdata/)
The average person in the Netherlands travels 15,5000 km/yr. (Source: cbs.com/2004)
The average car was estimated to get 30 mpg. (This estimate is actually a little low, meaning the people of the Netherlands consume less energy than calculated).

The following calculations and conversions were used to estimate the Energy per day that a person uses traveling by car:

15,500/365 = 42 km/yr
1 mpg = 0.425143707 km/litre
energy per unit of fuel = 10 kWh/litre (Source: McKay)
30 mpg * 0.425143707 = 12.75 km/litre

Energy per day = (distance traveled per day/distance of unit of fuel)*energy per unit of fuel

= [42 km/day]/[12.75 km/litre] * 10 kWh/litre = 32.94 kWh/day

Could the increase in CO2 be due to the reduction of biomass?

Deforestation: The conversion of forest to another land use or the long-term reduction of the tree canopy cover below a 10 percent threshold. Deforestation implies the long-term or permanent loss of forest cover and its transformation into another land use.


Figure 1. Area of Primary Forests in the United States


Tropical deforestation contributes as much as 90% of the current net release of biotic carbon dioxide into the atmosphere. This change may represent as much as 20% - 30% of the total carbon flux due to humans - rivaling tthe carbon release due to fossil fuel burning.


Recovery time of a forest after clearing and a burn. Note that it is only after 100+ years that forest become as they were before the cut. Forest regrowth sequesters atmospheric carbon as plant biomass.

Source: Deforestation

The increase in CO2 can be due to the reduction in biomass

Wednesday, September 7, 2011

What is "albedo" of the earth?

Astronomers use the term albedo to define the amount of light that an object in the solar system reflects. If a planet was perfectly shiny, it would reflect 100% of the light that hit it. If a planet was perfectly dark, it would reflect 0% of the light that struck it.


Figure 1. Earth's average albedo for March 2005, measured by the Clouds and Earth's Radiant Energy Systems (CERES) instrument aboard NASA's Terra satellite.

In the albedo image above, white shows areas where Earth reflected the highest percentage of shortwave solar radiation. Dark blue shows areas where Earth reflected the lowest percentage of shortwave solar radiation. Notice how the highest albedo values are in regions where Earth is mostly covered by snow and ice, or clouds, or both. The lowest albedo values occur in forest-covered landscapes or open ocean.

If Earth was covered in ice like a giant snowball, its albedo would be about 0.84, meaning it would reflect most (84 percent) of the sunlight that hit it. On the other hand, if Earth was completely covered by a dark green forest canopy, its albedo would be about 0.14, meaning most of the sunlight would get absorbed and our world would be far warmer than it is today.


Satellite measurements made since the late 1970s estimate Earth’s average albedo to be about 0.30.
Source: http://earthobservatory.nasa.gov/IOTD/view.php?id=5484


Another estimate of the Earth's albedo results in the figure 0.367.
Source: http://www.universetoday.com/25819/albedo-of-the-earth/

Any significant changes in the brightness of the land surface or in the extent of clouds and aerosols in the atmosphere affect how much sunlight Earth reflects, which, in turn, affects the climate system. A drop of as little as 0.01 in Earth’s albedo would have a major warming influence on climate—roughly equal to the effect of doubling the amount of carbon dioxide in the atmosphere, which would cause Earth to retain an additional 3.4 watts of energy for every square meter of surface area.


Tuesday, September 6, 2011

What are negative forcings?

Figure 1.  Estimated change of climate forcings between 1850 and 2000, based on with five principal aerosols delineated.
Source: http://www.giss.nasa.gov/research/features/200105_senate/page5.html


Negative forcing tends to cool the earth's surface.

While aerosols can have either positive or negative contributions to radiative forcing, the net effect of all aerosols added to the atmosphere has likely been negative. The best estimate of aerosols’ direct cooling effect is -0.5 Watts per square meter; the best estimate for their indirect cooling effect (by increasing the reflectivity of clouds) is -0.7 Watts per square meter, with an uncertainty range of -1.8 to -0.3 Watts per square meter. Therefore, the net effect of changes in aerosol radiative forcing has likely resulted in a small to relatively large cooling effect.

Figure 2. Climate forcings in the past 50 years, relative to 1950, due to six mechanisms. The first five forcings are based mainly on observations, with stratospheric H2O including only the source due to CH4 oxidation. GHGs include the wellmixed greenhouse gases, but not O3 and H2O. The tropospheric aerosol forcing is uncertain in both its magnitude and time dependence.

The above figure shows stratospheric aerosols which tend to be a negative forcing.


What are positive forcings?

Positive forcings tend to cause warming. CO2 has the largest forcing, but CH4, when its indirect effect on other gases is included, causes a forcing half as large as that of CO2. CO2 is likely to be increasingly dominant in the future, but the other forcings are not negligible


Figure 1. Estimated change of climate forcings between 1850 and 2000, based on with five principal aerosols delineated.

Source: http://www.giss.nasa.gov/research/features/200105_senate/page5.html

What are climate forcings?

Climate forcings are factors that drive or force the climate to change. The most important forcings during the last millenium were: changes in the output of energy from the sun, volcanic eruptions, and changes in the concentration of greenhouse gases in the atmosphere.

The figure below shows time series of these forcings using ice cores to measure levels of CO2, solar and volcanic activity over the last millennium.

Source:  http://www.ncdc.noaa.gov/paleo/globalwarming/gw-forcing.html

Note from source:

The size of these forcings is expressed in terms of Watts (a flux of energy) per square meter of the Earth's surface. Positive forcing warms the Earth, while negative forcing cools the Earth. Proxies do not record these forcings perfectly, so the time series are not known exactly. However, models that use these forcing time series are able to closely match the paleoclimate record of temperature for the last 1000 years. When CO2 is excluded, the models fail to simulate all of the warming of the 20th century, despite the generally successful simulation of the preceding centuries using only natural forcings (i.e., solar and volcanic variations). Model results (Crowley, T.J 2000) clearly indicate that greenhouse gas forcing is necessary for explaining the global warming of the 20th century.

Is human activity, particularly the use of fossil fuels, causing irreversible changes in earth's climate?

Based on the info in this blog so far, it seems as if the changes are not irreversible yet but are a concern and will take some serious time and effort to reverse.

If we aren't careful when dealing with our waste of energy and increasing CO2 emissions, the changes may become irreversible.

What is the scientific basis for AGW (anthropogenic global warming)?

Anthropogenic is defined as follows:
of, relating to, or resulting from the influence of human beings on nature.

Source: http://www.merriam-webster.com/dictionary/anthropogenic

Due to sunlight hitting the earth, infrared radiation is emitted by the earth. Greenhouse gases in the atmosphere absorb this radiation, which results in a warming of the earth. The greenhouse effect is normal when balanced and keeps the earths surface from being frozen all the time.

Since the industrial revolution, CO2 in the atmosphere has been increasing due primarily to the burning of fossil fuels and to deforestation. This causes an enhanced greenhouse effect which can lead to global warming.

There is a concensous among scientists that when the CO2 in the atmosphere reaches twice the pre-industrial level, the enhanced greenhouse effect alone will warm the earth by 1.2 to 1.3 degrees celsius.

Industrial age increases greenhouse effect

Industry took off in the mid-1700s, and people started emitting large amounts of greenhouse gases. Fossil fuels were burned more and more to run our cars, trucks, factories, planes and power plants, adding to the natural supply of greenhouse gases. The gases—which can stay in the atmosphere for centuries—are building up in the Earth’s atmosphere and, in effect, creating an extra-thick heat blanket around the Earth.

The result is that the globe has heated up by about one degree Fahrenheit over the past century—and it has heated up more intensely over the past two decades.

Source: http://www.edf.org/climate/basics-global-warming?gclid=CLLJhMb9iasCFUeFQAodj0lBsw


Source: http://www.edf.org/sites/default/files/climate/graph-world-global-temp-datasets_1.jpg


http://www.edf.org/sites/default/files/climate/csiro-global-mean-sealevel-400w.jpg

During the 20th century, sea level rose an average of 7 inches after 2,000 years of relatively little change.

The trends show an increase of global temperature and sea levels since the industrial revolution, which doesn't argue with the theory of AGW (anthropogenic global warming).

Using proxy records (ice cores, tree rings, and coral reefs) scientists have reconstructed the past 2,000 years of global surface temperatures, which shows a sharp uptick in temperature over the last few decades.


Source: http://www.edf.org/sites/default/files/climate/national-academies-proxy-temp-record-400w.jpg

Based on the graph, global temperatures have clearly spiked more than normal since the industrial revolution.

Where are greenhouse gases coming from?

In the United States, greenhouse gas (GHG) emissions come primarily from the burning of fossil fuels in energy use.


Carbon Dioxide
Energy-related carbon dioxide emissions (CO2), resulting from the combustion of petroleum, coal, and natural gas, represented about 81% of total U.S. human-caused (anthropogenic) GHG emissions in in 2009. About 1% of green house gases are CO2 from other human activities like cement manufacturing.

Methane and Other Gases
Another greenhouse gas, methane (CH4), comes from landfills, coal mines, oil and natural gas operations, and agriculture; it represented about 11% of total U.S. GHG emissions in 2009. Nitrous oxide (N2O) emissions, at about 3% of total GHG emissions, came from the use of nitrogen fertilizers, burning fossil fuels, and certain industrial and waste management processes. Several human-made gases, hydrofluorocarbons (HFCs), perfluorocarbons (PFCs), and sulfur hexafluoride (SF6), that are released as byproducts of industrial processes and through leakage, represented about 3% of total emissions.

The Energy Connection
Fossil fuels are made up of hydrogen and carbon. When fossil fuels are burned, the carbon combines with oxygen to create carbon dioxide. The amount of carbon dioxide produced depends on the carbon content of the fuel; for example, for each unit of energy produced, natural gas emits about half and petroleum fuels about three-quarters of the carbon dioxide produced by coal.


Most of Our Carbon Dioxide Emissions Come from Coal and Petroleum Use


Coal Is the Dominant Emissions Source Related to Electricity Generation


Source:
http://www.eia.gov/energyexplained/index.cfm?page=environment_where_ghg_come_from

What is Global warming potential? (GWP)?

The Global Warming Potential (GWP) provides a simple measure of the radiative effects of emissions of various greenhouse gases, integrated over a specified time horizon, relative to an equal mass of CO2 emissions. The GWP with respect to CO2is calculated using the formula:
where ai is the instantaneous radiative forcing due to the release of a unit mass of trace gas, i, into the atmosphere, at time TR, Ci is the amount of that unit mass remaining in the atmosphere at time, t, after its release and TH is TR plus the time horizon over which the calculation is performed (100 years in this table).

What are the sources of greenhouse gases?

In the U.S., our greenhouse gas emissions come mostly from energy use. These are driven largely by economic growth, fuel used for electricity generation, and weather patterns affecting heating and cooling needs. Energy-related carbon dioxide emissions, resulting from petroleum and natural gas, represent 82 percent of total U.S. human-made greenhouse gas emissions (Figure 1).

Figure 1.  U.S. Anthropogenic Greenhouse Gas Emissions by Gas, 2001
(Million Metric Tons of Carbon Equivalent)


What are greenhouse gases?

A greenhouse gas (sometimes abbreviated GHG) is a gas in an atmosphere that absorbs and emits radiation within the thermal infrared range. This process is the fundamental cause of the greenhouse effect.  The primary greenhouse gases in the Earth's atmosphere are water vapor, carbon dioxide, methane, nitrous oxide, and ozone.


What is the greenhouse effect?

The greenhouse effect is a process by which thermal radiation from a planetary surface is absorbed by atmospheric greenhouse gases, and is re-radiated in all directions. Since part of this re-radiation is back towards the surface, energy is transferred to the surface and the lower atmosphere. As a result, the temperature there is higher than it would be if direct heating by solar radiation were the only warming mechanism.


If the current energy profile of the world is sustained what impact will it have on the environment?

Even though the recession that began in 2008 caused short term energy consumption to decline by a total of 3.4% from 2008-2009, the long term trend is rising. With China and India growing in the industrial market, global energy consumption is rising faster now than in years past & continued growth is projected.

Figure 1. World Marketed Energy Consumption (quadrillion Btu)

(EECD stands for: Organization for Economic Cooperation and Development)

World marketed energy consumption increases by 49 percent from 2007 to 2035 in the Reference case. Total energy demand in non-OECD countries increases by 84 percent, compared with an increase of 14 percent in OECD countries.

http://205.254.135.24/oiaf/ieo/highlights.html

The main concern caused by our continued rise in energy usage from fossil fuels is the emissions of CO2 into the atmosphere and the imbalance of the amount that is created.

Today, there is more CO2 in the atmosphere than at any time in the last 800,000 years. Studies of the Earth’s climate history show that even small changes in CO2 levels generally have come with significant shifts in the global average temperature.
Scientists expect that, in the absence of effective policies to reduce greenhouse gas pollution, the global average temperature will increase, on the low end, 2.0 degrees Fahrenheit , and on the high end, 11.5 degrees Fahrenheit by 2100.


The carbon dioxide is released to the atmosphere where it remains for 100 to 200 years. This leads to an increasing concentration of carbon dioxide in our atmosphere (see above on the right hand side), which in turn causes the average temperature on Earth to raise (see graph below).


Figure 2. Increase of global average temperature for the last 20 years (source: wri.org)

Recent investigations have shown that inconceivable catastrophic changes in the environment will take place if the global temperatures increase by more than 2° C (3.6° F). A warming of 2° C (3.6° F) corresponds to a carbon dioxide (CO2) concentration of about 450 ppm (parts per million) in the atmosphere.
As of beginning of 2007, the CO2 concentration is already at 380 ppm and it raises on average 2 - 3 ppm each year, so that the critical value will be reached in approximately 20 to 30 years from now.


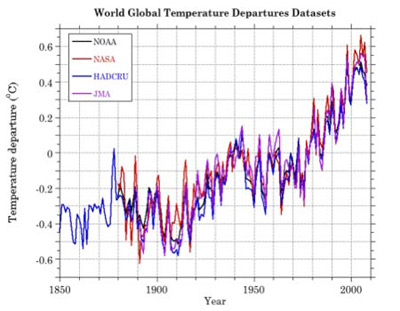
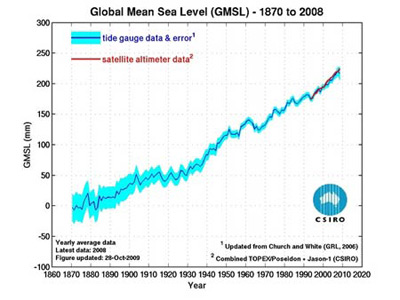
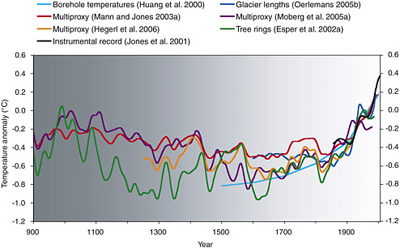
Global warming leads to the ice caps melting, ocean levels rising, and the PH levels in our water sources changing. This has a negative effect on the eco-sytem and endangers wildlife and can eventually destroy our environment, therefore endangering human existance. 
Figure 3. Means nothing! Just poking fun at people's emotions.

Monday, September 5, 2011

Can the Current Energy Consumption Profile Last?

                     Energy Consumption Trends
 http://en.wikipedia.org/wiki/File:World_Energy_consumption.png      (TW=Tera Watt)

Energy consumption profile trends are increasing over time as you can see from the graph above.

Never before has humanity faced such a challenging outlook for energy and the planet. As the global standard of living continually increases, we use more energy and emit more carbon dioxide.

The world can no longer avoid three hard truths about energy supply and demand.

1: Step-change in energy use
Developing nations, including population giants China and India, are entering their most energy-intensive phase of economic growth as they industrialise, build infrastructure, and increase their use of transportation.


2: Supply will struggle to keep pace
By 2015, growth in the production of easily accessible oil and gas will not match the projected rate of demand growth. While abundant coal exists in many parts of the world, transportation difficulties and environmental degradation ultimately pose limits to its growth. Meanwhile, alternative energy sources such as biofuels may become a much more significant part of the energy mix — but there is no “silver bullet” that will completely resolve supply-demand tensions.

3: Environmental stresses are increasing
Even if it were possible for fossil fuels to maintain their current share of the energy mix and respond to increased demand, CO2 emissions would then be on a pathway that could severely threaten human well-being.


World population has more than doubled since 1950 and is set to increase by 40% by 2050. History has shown that as people become richer they use more energy. Population and GDP will grow strongly in non-OECD countries and China and India are just starting their journey on the energy ladder.

http://www-static.shell.com/static/public/downloads/brochures/corporate_pkg/scenarios/shell_energy_scenarios_2050.pdf


The current energy consumption profile cannot last forever. Without conserving overall energy use and investing in more renewable energy sources, we will deplete our fossil fuels and not be able to sustain our current standard of living.

Thursday, September 1, 2011

What is the Carrying Capacity of the Earth?


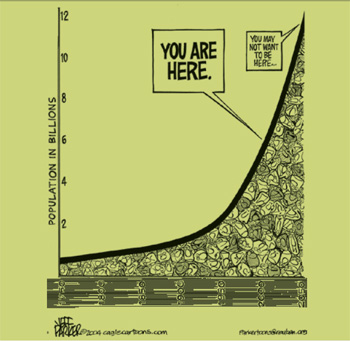
Carrying capacity is the maximum population size of a given species that an area can support without reducing its ability to support the same species in the future.


Estimates of carrying capacity have varied from less than 1 billion to over 1,000 billion (a trillion people). The average of the various estimates is around 10-15 billion.   (Link below)
http://www.biog1105-1106.org/demos/106/unit09/media/16.carryingcapacity.pdf


With advances in medicine and technology, humans are living longer and the population may spike more than estimated in the next 50 years.

Can we continue to live the way we do and not deplete our resources for future generations?


            Should we consider renewable sources of energy?